
Top 10 Chart Patterns Every Trader Should Understand
Specific price formations on a chart known as chart patterns indicate future price movements. Popular chart patterns have demonstrated that a specific price movement is likely to follow a particular configuration of price (chart pattern), as technical analysis is predicated on the idea that history repeats itself. As a result, chart patterns are divided into two categories: (1) continuation patterns, which indicate that the underlying trend will continue, and (2) reversal patterns, which indicate that the underlying trend will reverse.
Here are the top 10 chart patterns that every trader should be familiar with. The reversal patterns and their applications will be discussed in the first section.
Part 1 Reversal patterns
- Head and Shoulders
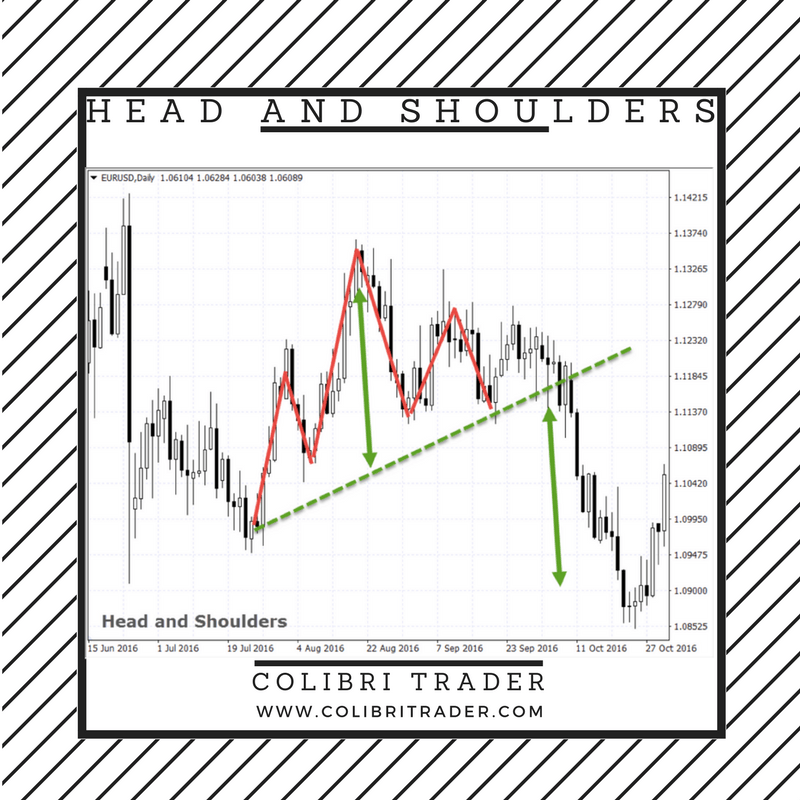
A reversal chart pattern called Head and Shoulders shows that the underlying trend is ready to change. There are three swing highs, the highest of which is the middle swing high (red lines on the chart). A lower high follows the intermediate swing high, indicating that buyers lacked the force to drive the price higher. The three swing highs pattern has the appearance of a head with a left and right shoulder, which is how it acquired its name.
A price target is the distance from the top of the head to the neckline, and a break-out below the neckline is seen as a selling indication. The neckline connects the two shoulders (green arrows). The identical inverse pattern (with three swing lows) is known as an Inverse Head and Shoulders pattern when the Head and Shoulders pattern appears during a downturn.
- Double Top and Double Bottom
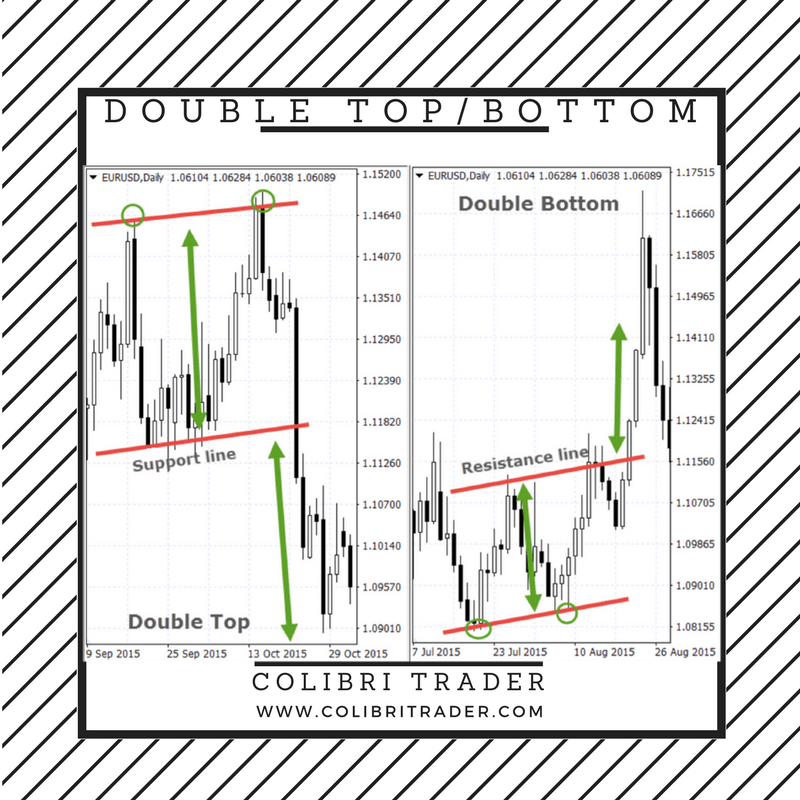
Another reversal pattern that appears during an uptrend or a decline, respectively, is the double top. As the name implies, a double top has two swing highs that are roughly the same price or slightly different. It demonstrates that purchasers were unable to raise the price, suggesting that a trend reversal may be imminent. When the support line is broken, a sell trade should be opened, and the target price is the distance between the formation's top and the support line. On the other hand, a double bottom pattern features two swing lows. The price could not be further lowered by the sellers. Breaking of the resistance line serves as the trigger signal, and the target price is the distance between the bottom and top of the range and the resistance line.
- Triple Top and Triple Bottom
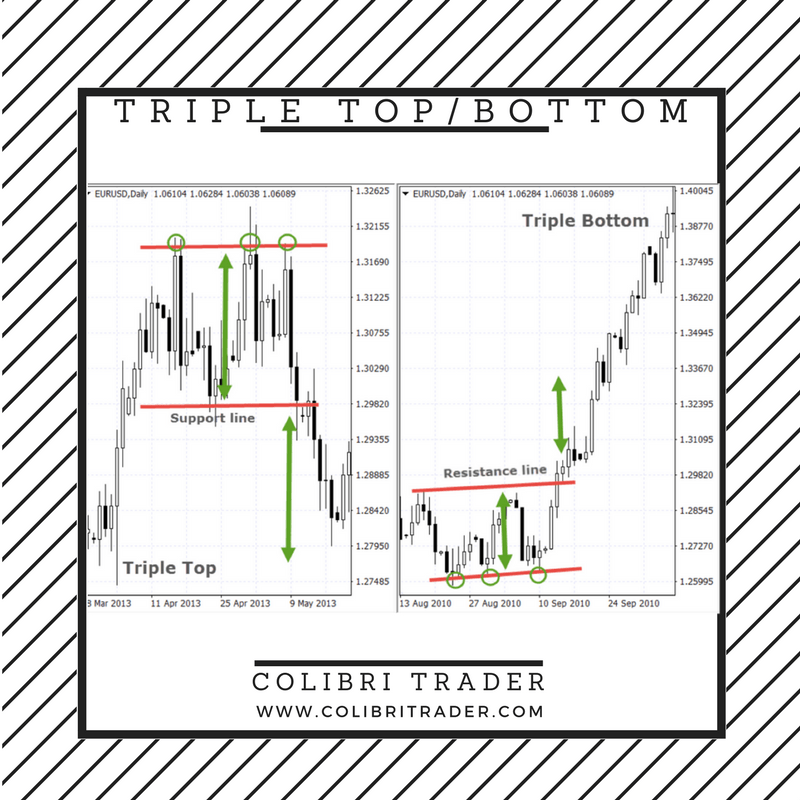
Double Top and Double Bottom formations are similar to Triple Top and Triple Bottom formations in most ways. Triple Tops and Bottoms are reversal patterns, but they differ in that they feature three swing highs and swing lows, respectively. Target prices are the distance between the top and support line (for triple tops) and bottom and resistance line, respectively, while trigger signals are once more the breaking of support and resistance lines (for Triple Bottoms).
- Rounding Top
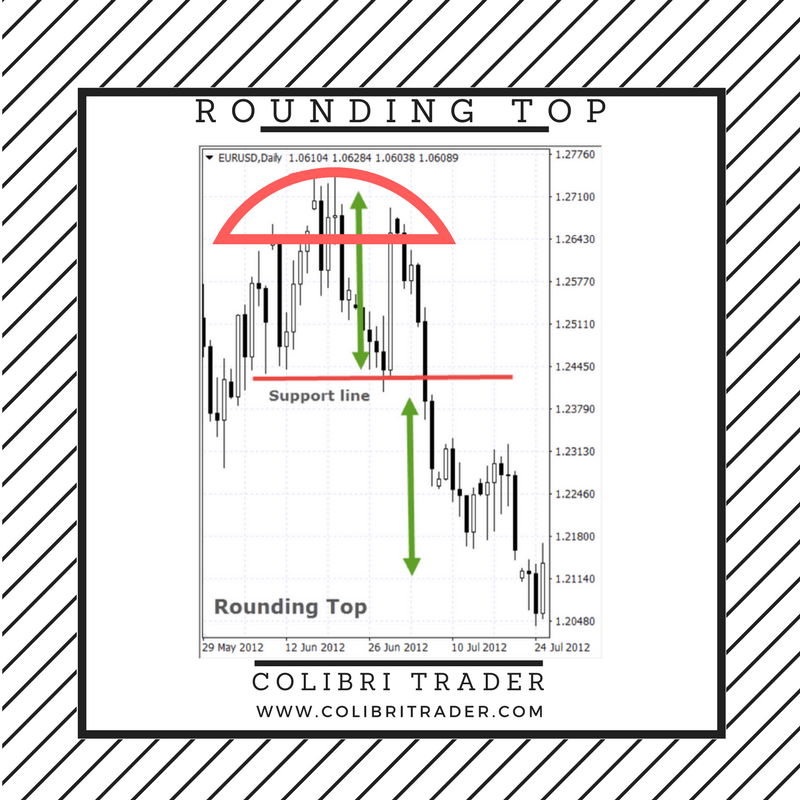
Compared to the other chart patterns mentioned, the Rounding Top pattern takes a little longer to emerge. It demonstrates a steady shift in attitude from bullish to bearish. On the chart, a "rounded top" is gradually formed by the price. The breaking of the support line serves as the signal to start a short position, with the price goal set at the distance from the top to the support line.
- Rounding Bottom
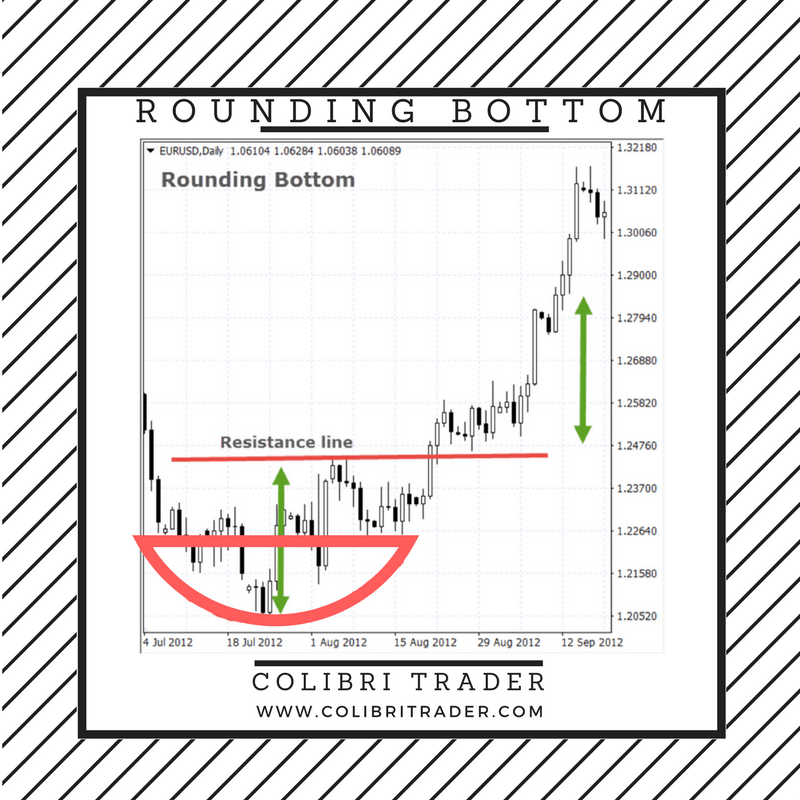
Rounding Bottoms are Rounding Tops that have been turned vertically. A "rounded bottom" or gradual change in the price from the prior downward trend was visible. The breaking of the resistance line serves as the same trigger as the Rounding Top. The gap between the bottom and the resistance line is the price target.
Chart Patterns from Part 2, Continuation
I'll outline the most common continuation chart patterns in this section. Both continuation and reversal patterns are significant. They are more suited for trend following, a different type of trading. While continuation patterns are seen to be useful for finding a suitable entry point to follow the trend, reversal patterns are thought to be good for swing traders and contrarian traders. The subsequent patterns will provide you a fresh trading perspective. I'll begin with the rectangle, which is the first one:
- Rectangles
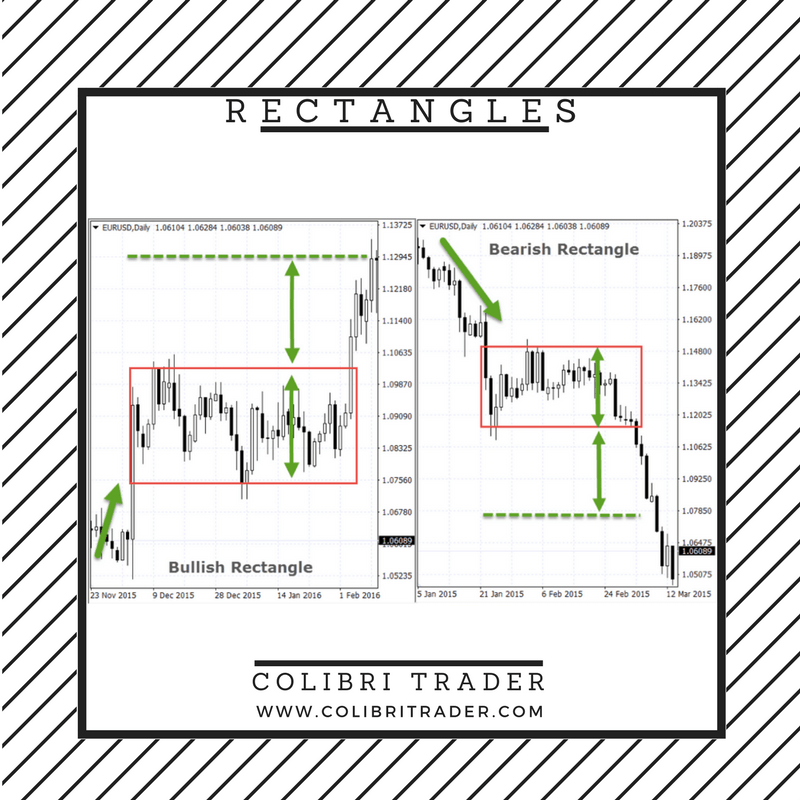
A rectangle is a continuation pattern, which means it confirms that the underlying trend should continue. It is divided into bullish and bearish rectangles, depending on the underlying trend. A bullish rectangle appears during an uptrend, when the price enters a congestion phase, during a sideways trading. The price will likely break out in the direction of the preceding trend. The trigger signal is the break of the upper line of the rectangle, with the price target being the height of the rectangle. For the bearish rectangle, the opposite rules apply. It forms during a prevailing downtrend, when the price enters a congestion phase and trades sideways. This means the trend will most likely continue downwards, with the break of the lower rectangle line. The price target is again the height of the rectangle.
- Wedges
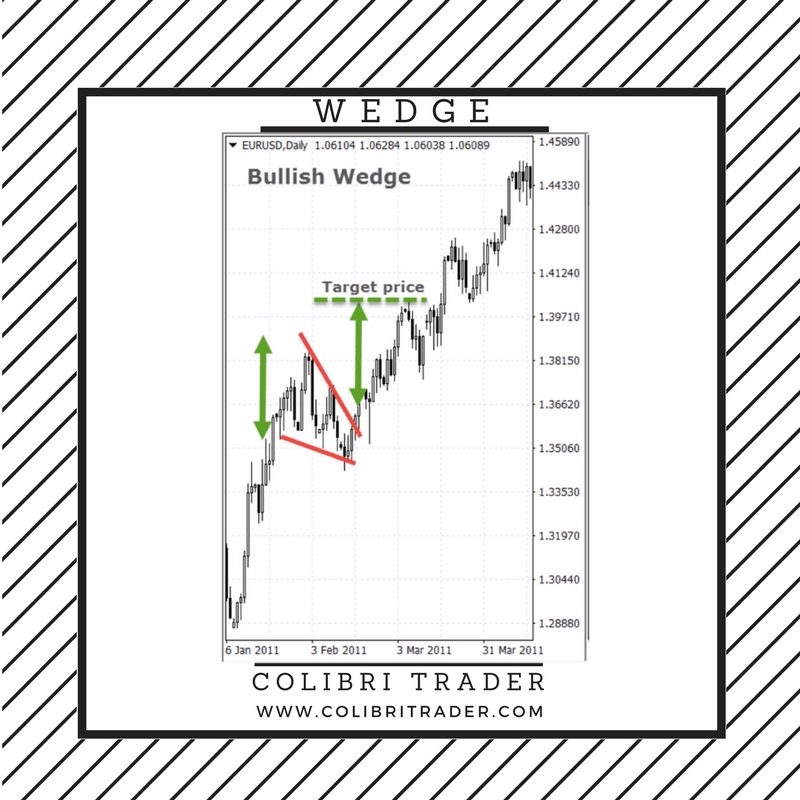
A wedge is another continuation pattern. A bullish wedge forms during an uptrend, as the price trades inside converging trendlines. These converging trendlines imply that sellers are trying to push the price lower, but don’t have enough strength to win against the buyers. Ultimately, the buyers win and the price breaks through the upper trendline, indicating that the uptrend will resume. Target prices are calculated as the maximal height of the wedge, which is then projected to the point of break-out. A bearish wedge is similar to a bullish one, with the difference that it is appearing during downtrends, and the slope of the wedge is up. Converging trendlines are again showing that buyers interrupted the downtrend, trying to push prices higher. A break-out through the lower trendline indicates that sellers won the battle, and the downtrend is resuming. The target price is, like by bullish wedges, the maximal height of the wedge which is then projected to the point of break-out.
- Flags
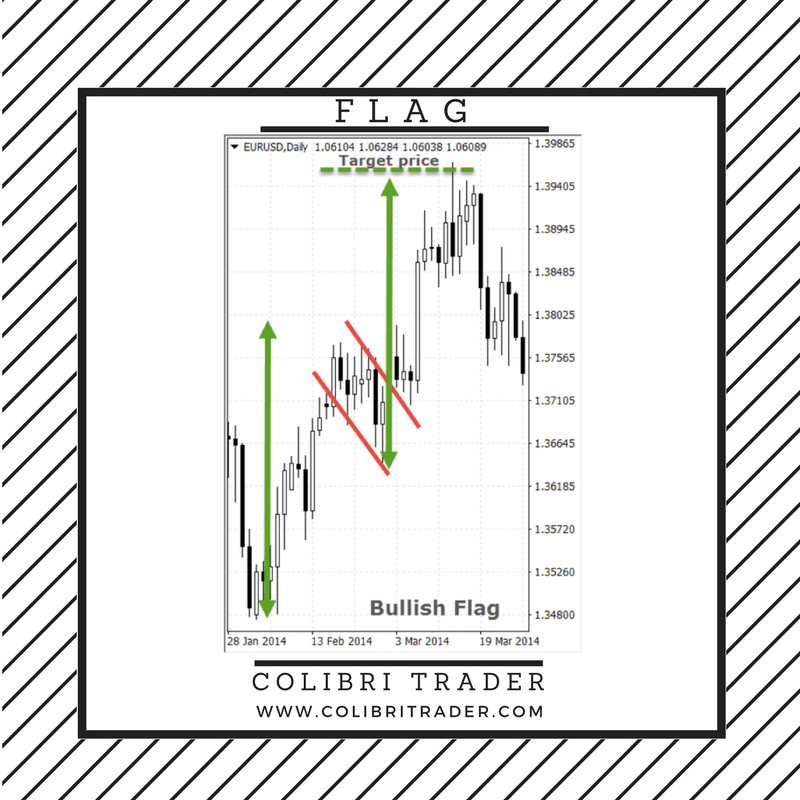
A flag is very similar to a wedge, with the difference that the trendlines which form the flag are parallel, and not converging. A flag pole is also a part of the flag pattern, because the target price is measured in a different way than by other chart patterns. Flags can be bullish and bearish, with a bullish flag shown on the chart above. A bullish flag forms during an uptrend, with parallel trendlines above and below the price-action, which form a down slope. A break-out above confirms that the uptrend is resuming. A bearish flag is pretty much the same as a bullish flag, with the difference that it forms during downtrends and has an up slope. The price target is measured as the height of the flagpole (green arrow) to the top of the flag, which is then projected to the lowest point of a bullish flag (or heighest point of a bearish flag).
- Triangles
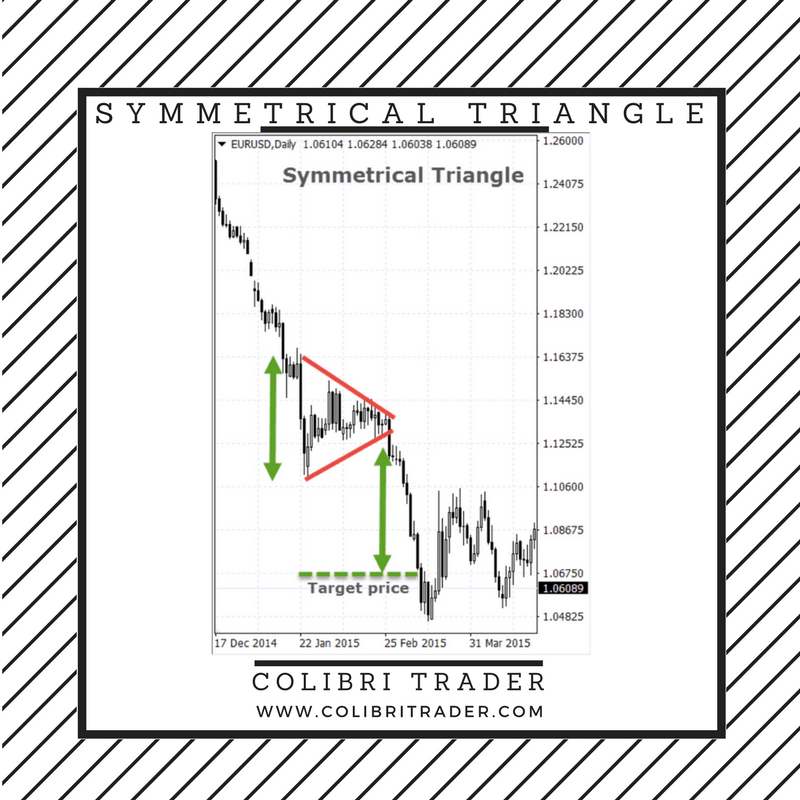
Triangles can be ascending, descending and symmetrical. All three types of triangles look pretty much the same, with the difference that ascending triangles have a flat upper trendline, and descending triangles a flat lower trendline. A symmetrical trendline is the most common, and forms during both up- and downtrends. It has converging trendlines, just like a wedge pattern, but the slope is neither pointing up or down. The breakout point of the lower trendline during downtrends confirms that the downtrend is resuming, while a breakout of the upper trendline during uptrends confirm the underlying uptrend. The target price is the height of the triangle, projected to the point of the breakout.
- Cup and Handle
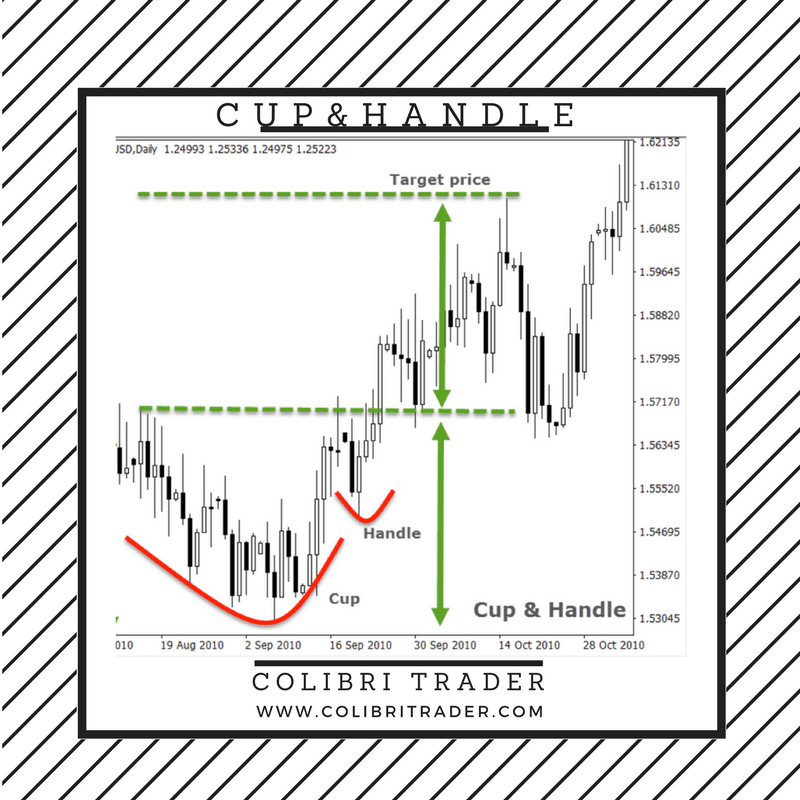
A Cup and Handle pattern is a Rounding Top pattern with an additional pullback (the handle). It is a continuation pattern which shows that in middle of an uptrend, the sellers tried to push the price lower, but the sentiment is again gradually changing from the sellers to the buyers. Additionally, a pullback occurs as the last attempt of the sellers to dominate. After a break-out of the resistance line (green dotted line), the target price is calculated as the height of the Cup & Handle pattern. An Inverse Cup & Handle pattern appears during downtrends, and the inverse rules of a regular Cup & Handle apply for it.